| |||||||||
|


Analysis of a 2000 MB Write to an F85 File Server
In order to get a general idea of what happens during a large write, I used my rpcstat tool to monitor a 2 GB write test. To obtain maximum granularity, I sampled the data as fast as possible rather than at a specified interval. This gave me a granularity of approximately .15 ms. Unfortunately, sampling at this rate consumes a lot of resources - 100 % of one of the cpus. The actual test ran on the other cpu.
Overall
Below is a graph from the beginning to the end of the test. In order to make the data manageable, I smoothed it out to approximately 100 ms resolution.
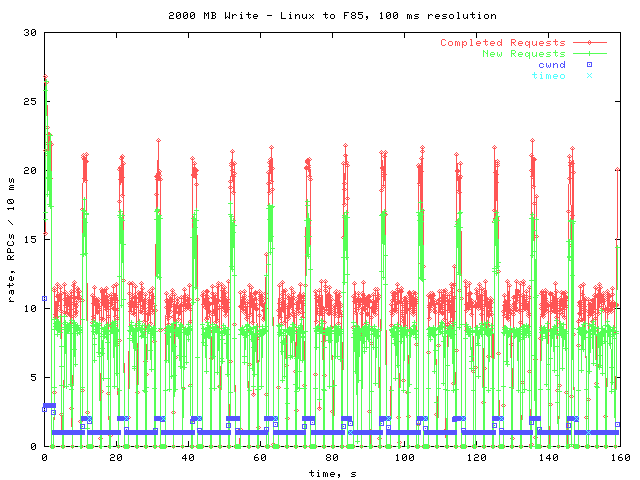
The lines of primary interest are Completed Requests and New Requests. As you can see, both oscillate between two levels. This oscillation is caused by the oscillation of the congestion window, cwnd on the graph. When cwnd is 1, the rates are at their lower levels. After a little while, the cwnd is increased to 2, which corresponds to the higher levels. However, shortly after the cwnd becomes 2 a timeout occurs and the cwnd goes back to 1.
One interesting thing to notice is that when the cwnd goes up, allowing requests to be completed more quickly, the rate that new requests arrive also increases. This suggests that the rate of new requests is being throttled to let the RPC layer keep up.
A Closer Look
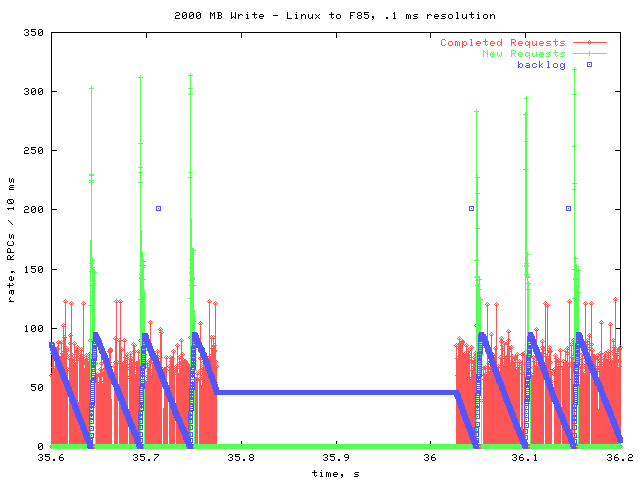
Next is a graph of the same data, from 1 to 1.1 seconds. In this graph I did not smooth out the data points, so the resolution is approximately .15 ms.
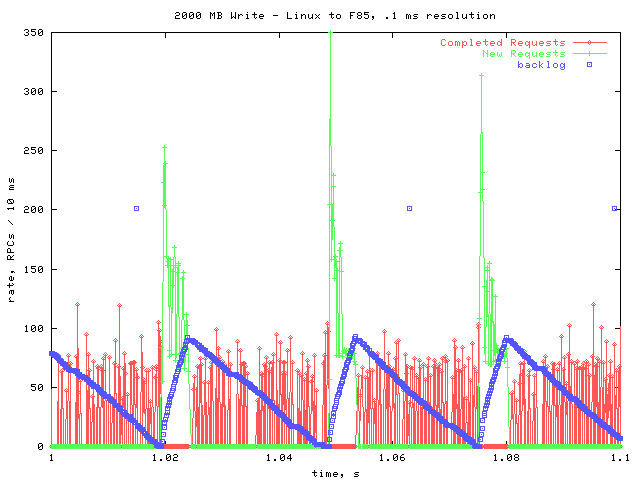
On this graph, I included the count of how many requests are on the backlog. The points with a y value of 200 may be ignored- they are the result of a known bug in rpcstat.
As you can see, there is another periodic pattern on this level. New requests are issued in a burst, causing the backlog to fill up. The RPC layer then begins processing those requests. Once the backlog has been reduced to zero again, a new burst of requests is issued. This helps explain the throttling observed in the overall picture; After a burst of requests is issued, another is not issued until all the outstanding requests are completed.
Notice that during the time that new requests are being issued, no requests are being completed. This may be because the cpu is spending all of its time issuing new requests, not allowing the rpciod to complete any. However, it may be because of the latency between getting the first request in the burst, and being able to complete it. Further examination is necessary- it will help to measure how long it takes to complete a write request from beginning to end.
Timeout
The next graph shows what happens during a typical timeout.
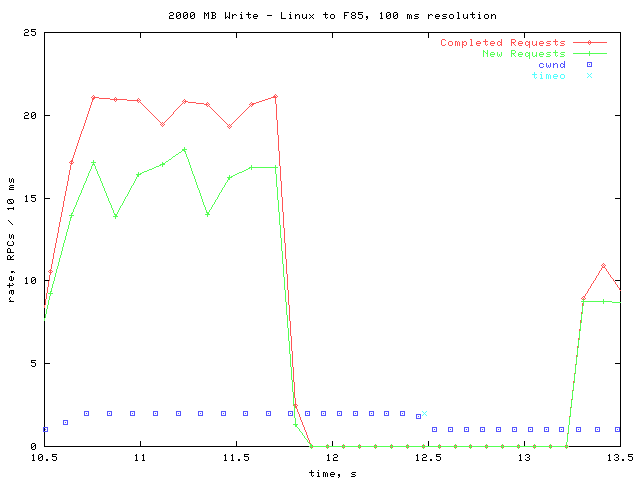
At just after 10.5 seconds, the congestion window increases from 1 to 2. About 1.5 seconds later, all activity ceases. At about 12.5 seconds, two requests time out, and the congestion window is reduced back to 1. Over half a second later, processing resumes.
More precisely:
| processing stops | 11.7787 s |
| timeouts | 12.4775 s (.6988 s later) |
| processing resumes | 13.2670 s (.7895 s later) |
It is expected that after the 2 packets are lost, no activity should occur until xprt_timer is called. However, I'm not sure why there is an additional ~.8 s delay afterwards.
Regular Gaps
Next is a graph of 10 seconds, with smoothed data points.
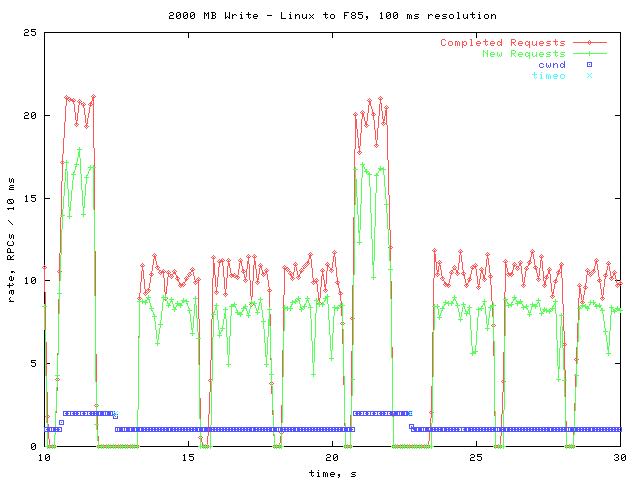
The interesting thing to note here is that approximately every 3 seconds, there is a gap during which no activity takes place. This occurs throughout the entire write operation, but the gaps are too small to see in the overall graph.
Here is a closer look at one of the gaps.
All activity ceases in the middle of one of the backlog cycles. I checked the pending queue count, and for all the gaps, there is a pending RPC during the gap. This leads me to believe that the gap is due to the server taking a longer time than usual to process a request. One possible explanation is that the NVRAM is filling up every 3 seconds, and must then be flushed to disk.
Conclusions
There are a few areas that warrant further investigation. One is the manner in which the kernel periodically waits until all pending requests are completed before sending any more. This may be causing the gaps in between cycles. If so, performance may be improved by making write requests more evenly.
The gaps every 3 seconds are also interesting. Further work should be done to find their cause.
Perhaps most important is the question of why there are timeouts whenever the congestion window is increased to two. The throughput with a cwnd of one is significantly lower than when it is set to two. Also, there is a significant delay whenever there is a timeout.
|
 |