| |||||||||
|


SpecWeb99
About SpecWeb99
Stuff about what the benchmark is and why we use it.
Setup
Stuff about the machines, who acts as what, so on and so forth.
Experiments
Kinda like a log of work done with SpecWeb. What we've discovered, what we have questions about. Stuff like that.
PGBench
About PGBench
PGBench is a simple database transaction benchmark that comes with the PostgreSQL source in the contrib directory. It uses the PostgreSQL libraries to interface with the PostgreSQL database server. It simulates a configurable number of clients connecting to the a database and processing a configurable number of transactions and reports how many transactions per second (tps) the database can process. These TPS results are given for the overall system, not per client. The pgbench program is single threaded, but uses the asynchronous capabilities of the PostgreSQL libraries to simulate concurrent connections. The same type of transaction is used by all clients. This benchmark is similar to the now deprecated TPC-B transaction processing benchmark.
While the transaction pattern is not varied and the number of tables used by this benchmark is relatively small, this benchmark is useful for a couple of reasons. First of all, it helps us tune our database so we can put more stress on the filesystem. Second, as we are in the business of testing filesystem performance as opposed to database server performance, we do not require that all facets of a database server be tested. The downside to using a small number of tables though is that locking and transaction synchronization may be the cause of some performance bottlenecks and we may not be able to generate a significant load on the filesystem.
Setup
The database server (postmaster) is setup on climax. It was compiled without any changes to the source and no special options were given during configuration. When tests are run, special options are passed to the postmaster on the command line. The general options given on the command line increase the number of concurrent connections allowed to the database, increase the number of shared buffers used by the postmaster, increase the number of WAL buffers, and increase the amount of time between commits. These options are set in the hopes of delaying and coalescing random writes to the database so we can focus more on NFS issues than disk limitations.
The directory where the database and its meta information are stored can be in many different places. The first option is in a local directory mounted as an ext2 formatted filesystem on a local scsi disk. The ext2 filesystem used 4k block sizes. The second option is on an ext2 formatted filesystem on a 2-disk local raid partition. This raid partition also used 4k block sizes for ext2. The partition is a raid-0 (striping) partition, managed by a software raid controller using 512k chunks. The third option is in an nfs mounted directory served by our NFS Filer. The nfs directory is mounted with "nfsvers=3,rsize=8192,wsize=8192" as the set of options. It should also be noted that the actual database files and the WAL files can be kept on different partitions. This is done quite frequently in our experiments, so when test results are presented, we will also specify where the different components of the database system are kept.
The pgbench program is a separately compiled program linked against the PostgreSQL library (libpq). Because the postmaster can be configured to accept connections on local UNIX-domain sockets or from remote TCP/IP sockets, we have two options with regard to where we run the pgbench program. When run locally, pgbench is run on climax along with the postmaster. Running in this configuration though can take valuable resources away from the postmaster when running an intense benchmark. Thus, we can also run pgbench from tiffin using a TCP/IP connection. As with the database files, the location of the pgbench clients will be specified when results are given.
Experiments
June 19, 2001
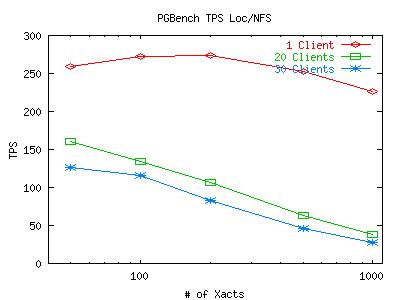
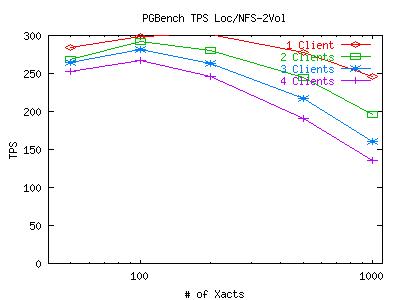
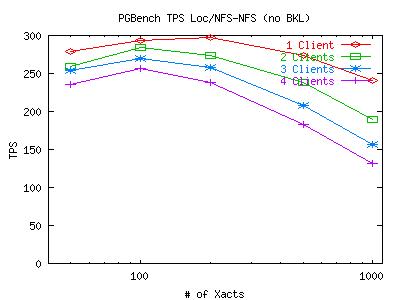
In the course of testing our initial setup to determine whether it worked or not (not necessarily tuning), we have noticed something strange. Transactions Per Second (TPS) measurements from pgbench fall drastically as the number of connecting clients increases. After monitoring the network and taking a profile of the kernel during these tests, we have ruled out the network and the CPU as the cause of any bottleneck as the cpu spent most of its time in an idle loop and network usage was under 2%. While the wealth of resources is not surprising for the light loads, the performance degradation is. These tests were run with pgbench running locally (on climax) and the degradation is present for both the NFS and local databases.
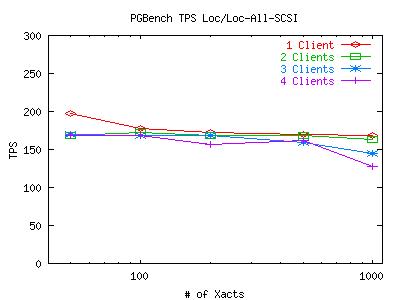
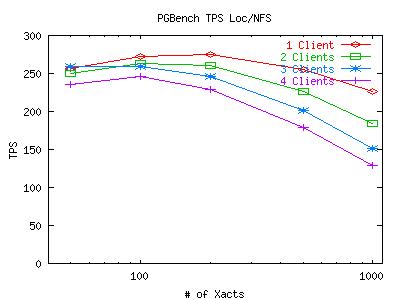
Here are some graphs which plot the TPS measurements for various numbers of concurrent connections (clients) from pgbench. The X-axis represents how many transactions each client has to execute before dropping out of the test. The points taken on the X-axis are 50, 100, 200, 500 and 1000 transactions. Note that the X-axis is on a log-scale. For both of these graphs, the postmaster and pgbench client were on climax and the DB files and WAL files were on the same partition (be it the local scsi disk or the mounted NFS volume). Click on the graph for a larger image.
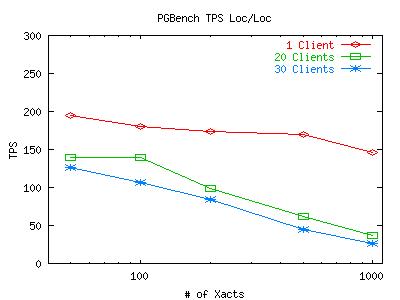
It appears that the postmaster is creating a bottleneck when it tries to serialize all the transactions. While serialization is not an issue for 1 client, it can become troublesome for 30 clients. After looking closely at the code for pgbench, we have determined that it does not take care to lock any data on its own, so any hold up due to synchronization is due the the default synchronization mechanism for transactions that Postgresql uses. While we cannot be certain that this is a Postgresql issue as opposed to a filesystem limitation, it does appear likely that this is the case. With this in mind, we will move on to explore other interesting properties of these initial graphs. All tests after this point will be run with a small number of clients so we can avoid this synchronization problem.
June 22, 2001
The graphs above not only show the affects of transaction synchronization, but they also show an interesting despairity between the local and NFS database performance. So, in an effort to try to improve the local performance, I re-ran the local database tests while tuning various details to help improve database performance and disk throughput. The changes made included turning off debugging output in the postmaster, and storing the WAL files on a separate SCSI disk (to separate random access patterns from sequential). The results below are the average of 10 runs before and after these changes. Click on the graph for a larger image.
July 6, 2001
As you can see, using 2 disks didn't help the situation much. So I looked at some iostat output and saw that there was quite a bit of output to the disk with the WAL files (as expected). So I tried tuning some SCSI-controller parameters to see if they had any affect on the results. Below are two graphs plotting the results for the default 2-disk SCSI test, and the same with the SCSI tagged command queue size increased from 4 to 32. A number of other SCSI parameters were also set at boot time. The full list of arguments passed to the controller at boot-time (including defaults) for the second graph looks like this: "sym53c8xx=mpar:n,spar:n,disc:y,ultra:3,tags:32,sync:5,verb:0,debug:0,burst:7,led:0,pcifix:5" I verified before the tests that the SCSI bus for both cases was a 16-bit bus running at 40MHz. (The ultra=3 parameter causes the controller to try running at Ultra3 speeds, then Ultra2 and so on. Being Ultra2 disks, Ultra2 is where the controller finally runs.)
July 9, 2001
Well, the last set of graphs shows us that SCSI tuning isn't really the issue here. Something else is keeping local performance down. So, because I have two SCSI disks available to me, I thought I'd try striping the database partition over the two disks and create a RAID-0 device. To create the device I followed an example I found on the web. Using the default parameters shown on the web (8k chunks), the performance of the local disk changed, but not for the better. Below are two graphs which show the two-partition ext2 setup vs the two-disk RAID-0 setup. For the RAID-0 test, the database files were kept on the NFS filer so we could separate random and sequential writes and take full advantage of the striping.
July 10, 2001
Obviously, something is amiss with our raid partition. So I went out and did a bit of research on how to improve the situation. I increased the chunk size used by the RAID device from 8k to 512k. I also found some notes in section 4.9 of the Linux Software RAID HOWTO on tuning an ext2 filesystem to perform better with RAID levels 4 and 5. The author did not know if the same techniques would help with any other raid level. So I ran some quick tests with Bonnie to tune the RAID-0 device and compare its raw performance with the plain SCSI disk and the NFS filer. Here's a table of the results.
| Sequential Output | Sequential Input | Random Seeks | |||||||||||
|---|---|---|---|---|---|---|---|---|---|---|---|---|---|
| Per Char | Block | Rewrite | Per Char | Block | Block | ||||||||
| Storage | File Size (MB) | K/Sec | % CPU | K/Sec | % CPU | K/Sec | % CPU | K/Sec | % CPU | K/Sec | % CPU | Per Sec | % CPU |
| SCSI-ext2 | 100 | 12996 | 99.9 | 225896 | 99.3 | 178437 | 99.3 | 12623 | 100.0 | 552510 | 97.1 | 27720.4 | 104.0 |
| SCSI-ext2 | 200 | 12956 | 99.3 | 218188 | 95.9 | 165217 | 96.0 | 12594 | 99.9 | 553501 | 100.0 | 24792.2 | 93.0 |
| SCSI-ext2 | 500 | 12836 | 99.0 | 58581 | 27.2 | 8509 | 5.9 | 9409 | 75.7 | 27475 | 9.6 | 3897.3 | 12.7 |
| SCSI-ext2 | 1000 | 12804 | 98.9 | 37651 | 17.7 | 8172 | 5.7 | 10690 | 86.3 | 26940 | 8.2 | 374.3 | 2.4 |
| RAID0-8k-nostride | 100 | 13014 | 100.0 | 226193 | 99.4 | 181958 | 99.5 | 12622 | 100.0 | 551480 | 102.3 | 27768.3 | 97.2 |
| RAID0-8k-nostride | 200 | 12960 | 99.7 | 215796 | 93.8 | 159766 | 92.8 | 12604 | 100.0 | 551746 | 99.7 | 22707.9 | 90.8 |
| RAID0-8k-nostride | 500 | 12822 | 98.8 | 101605 | 47.8 | 16556 | 11.7 | 12147 | 98.2 | 47448 | 18.4 | 3843.2 | 20.2 |
| RAID0-8k-nostride | 1000 | 12795 | 98.6 | 61704 | 28.9 | 16489 | 11.9 | 12108 | 98.3 | 46795 | 16.6 | 374.2 | 2.2 |
| RAID0-8k-stride | 100 | 12995 | 99.8 | 226941 | 99.7 | 182174 | 99.6 | 12621 | 100.1 | 552447 | 97.1 | 27814.9 | 97.4 |
| RAID0-8k-stride | 200 | 12859 | 98.9 | 206843 | 93.9 | 159119 | 94.0 | 12582 | 100.0 | 552850 | 99.9 | 23499.4 | 94.0 |
| RAID0-8k-stride | 500 | 12795 | 99.0 | 92327 | 43.1 | 20251 | 13.8 | 12197 | 98.3 | 48138 | 17.3 | 3640.0 | 10.0 |
| RAID0-8k-stride | 1000 | 12812 | 98.9 | 63690 | 30.4 | 16520 | 12.5 | 12107 | 98.2 | 46892 | 16.4 | 383.7 | 2.6 |
| RAID0-128k-stride | 100 | 12996 | 99.9 | 224812 | 101.0 | 182136 | 99.6 | 12620 | 100.0 | 552435 | 102.5 | 27780.5 | 97.2 |
| RAID0-128k-stride | 200 | 12926 | 99.7 | 208470 | 94.7 | 159826 | 96.0 | 12584 | 99.9 | 551713 | 99.7 | 22540.7 | 78.9 |
| RAID0-128k-stride | 500 | 12841 | 99.3 | 93347 | 45.4 | 20546 | 14.7 | 12224 | 98.8 | 47925 | 18.2 | 2788.9 | 16.7 |
| RAID0-128k-stride | 1000 | 12813 | 99.1 | 62531 | 30.3 | 19429 | 14.8 | 12187 | 99.0 | 46948 | 17.1 | 501.0 | 3.6 |
| RAID0-512k-stride | 100 | 13001 | 99.9 | 229559 | 100.9 | 176425 | 99.9 | 12621 | 100.0 | 553552 | 102.7 | 27866.6 | 97.5 |
| RAID0-512k-stride | 200 | 12935 | 99.5 | 212116 | 92.2 | 156481 | 94.7 | 12594 | 99.9 | 553271 | 100.0 | 22789.9 | 85.5 |
| RAID0-512k-stride | 500 | 12829 | 99.2 | 88269 | 41.9 | 23635 | 19.7 | 12249 | 99.0 | 48083 | 16.3 | 2858.2 | 16.4 |
| RAID0-512k-stride | 1000 | 12815 | 99.1 | 64177 | 30.3 | 19796 | 15.4 | 12205 | 99.1 | 47638 | 16.3 | 553.8 | 4.2 |
| NFS Filer | 100 | 11702 | 97.3 | 15311 | 8.4 | 13886 | 9.8 | 12639 | 100.0 | 547819 | 101.6 | 17615.9 | 83.7 |
| NFS Filer | 200 | 11776 | 97.6 | 13285 | 5.4 | 13465 | 9.3 | 12638 | 100.0 | 549556 | 99.3 | 17781.7 | 97.8 |
| NFS Filer | 500 | 11774 | 97.5 | 12941 | 6.5 | 9379 | 6.4 | 11415 | 94.4 | 17982 | 10.9 | 1480.0 | 8.1 |
| NFS Filer | 1000 | 11766 | 97.5 | 12194 | 6.8 | 6003 | 4.2 | 10363 | 92.7 | 12041 | 6.0 | 129.5 | 1.5 |
This table indicates that the using the "stride" when creating an ext2 filesystem on a RAID-0 device is indeed helpful. Using this information, I recreated the RAID device and reran the test I described yesterday. Here are the results.
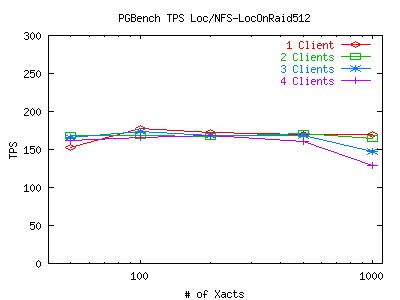
Seems a bit strange that Bonnie would report 2x improvement in sequential write throughput (as we would expect) but the actual performance in this benchmark remains unchanged. Whats going on here?
July 11, 2001
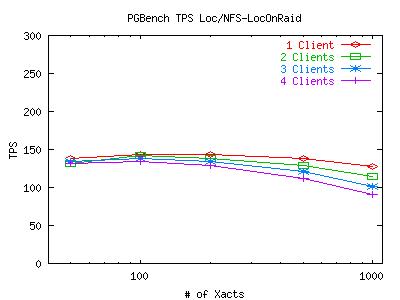
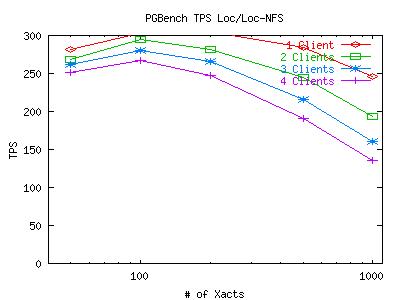
Well, now that I've tuned the local disk as best as I can, I'll turn my attention to the NFS filer. One of the techniques used above which I can also use with the filer is to separate the DB files from the WAL files. Again, this is useful because the disks used for the WAL files can then take advantage of their sequential access pattern. Here are two graphs comparing the performance of keeping the DB and WAL files on the same NFS volume (2-disk RAID-0) and keeping them on two different NFS volumes.
So, the 2 volume set up does indeed show some improvement. Just to verify that the WAL is a much more sequential access pattern, we ran another test locally and used strace to look for calls to lseek().
| "Global" DB File Seeks | 3715 | "Global" files are files with names of the form "/usr/local/pgsql/dbs-local/postgresql/global/*" |
|---|---|---|
| "Base" DB File Seeks | 275408 | "Base" files are files with names of the form "/usr/local/pgsql/dbs-local/postgresql/base/*" |
| WAL File Seeks | 16095 |
So, the WAL files are quite a bit more sequential than the DB files, especially considering they are written to with a much greater frequency than the DB files. It is interesting to note though, that of the 16,000 WAL seeks, over 99% of them are valid seeks to an non-zero offset somewhere in a WAL file (SEEK_SET with an offset of 10,000,000 typically). The other < 1% are seeks to the end of the file.
So, I've actually been looking at this for a while, but I thought I'd describe all of my tuning efforts first. Now that the storage is fairly well tuned for database performance, lets run pgbench in 4 different configurations to see how they compare. I mentioned before that the DB and WAL files can be kept locally or on NFS and they don't have to be in the same place as the other. So how do the four combinations of these locations compare? Here's a 4-graph table which raises some interesting questions. Click on any graph to enlarge it.
| Local WAL | NFS WAL | |
|---|---|---|
| Local DB | |
 |
| NFS DB | |
|
Obviously, its the WAL files which are causing the bottleneck for the local disk performance. This is somewhat expected since DB performance is mostly limited by WAL performance (because the random-write commits to the actual DB files are delayed as much as possible while the WALs fill up and usually write much less data). What is a bit surprising is the fact that striping the local disk does not improve WAL performance on local disks. The next series of experiments will try to determine why WAL performance suffers so much on the local disk.
July 16, 2001
So the theory goes, the NFS WAL performance is much faster than local WAL performance because of the NVRAM on the filer. If this is indeed the case, then we would expect to see performance similar to the SCSI disks when using cupertino as our NFS filer instead of plymouth because it does not have the advantage of using NVRAM. So I ran some more iterations using cupertino instead of plymouth and heres the results:
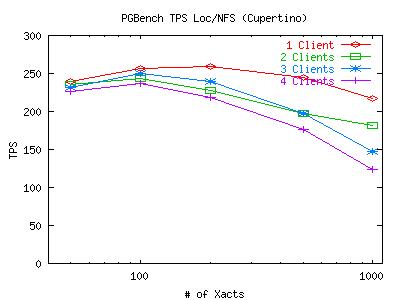
Not very encouraging. Of course the graph is a little lower than the ones in the 4-graph table above, but thats because all the files are on the same disk on Cupertino. The similar performance to the filer suggests that something other than NVRAM is responsible for the superior NFS performance. Next I'll look into the number of open/write/lseek/close/fsync calls and see what files they are being called on and how they interact. I suspect that because open does close to nothing in NFS (and does significantly more locally), that it may be the source of some of our bottleneck. This would also explain why striping (which does improve raw write performance according to Bonnie) does not improve WAL performance for this benchmark.
July 17, 2001
To expand on the lseek results above, I thought I'd take a look at a local run and see if I saw any difference in behavior between the DB files and the WAL files that would explain why the WALs are a bottleneck and the DBs aren't. Here's an expanded version of the table from above (from a different strace of a similar test):
| Opens | Reads | Writes | Seeks | Closes | FSync | FDSync | ||
|---|---|---|---|---|---|---|---|---|
| Global | 379 | 139 | 18 | 2481 | 167 | 4 | 0 | |
| Base | 5185 | 48525 | 31296 | 259148 | 3337 | 13 | 1180 | |
| WALs | 70 | 0 | 16420 | 10416 | 3 | 0 | 4232 |
The typical read and write size for all three types of files is 8k. So, now I'm thoroughly perplexed. If the NVRAM isn't responsible for the good NFS performance, and all file operations are performed more often on the DB files than on WAL files, why are the WAL's a bottleneck?
So, as you can see, I have added two "sync" columns to the above table which may provide some insight as to why the WALs are the bottleneck. I'll explore this next. But it still doesn't help me understand why Cupertino handled the multitude of fdatasync calls via nfs any better than the local disk. The filer is capable of this, of course, because of the NVRAM, but Cupertino has no NVRAM. So if the fsyncs are the issue, is Cupertino cheating somehow to get its performance up?
July 20, 2001
So after a little more than a day of mucking with kernel code to get some timers set up in sys_fsync and reported via the /proc filesystem, I finally have some numbers of interest. This table presents how much time (in us) it takes to execute fsync() and fdatasync() inside the kernel (ie, not including syscall overhead). The number of times each system call is invoked ("Num" in the table) is for running the pgbench benchmark to obtain one point (1 client, 200 transactions) on all the graphs I've been presenting so far.
| Backing Store | Num | Avg | Min | Max |
|---|---|---|---|---|
| fsync() | ||||
| NFS-Plymouth | 21 | 9422 | 1 | 96122 |
| NFS-Cupertino | 21 | 1252 | 4 | 9340 |
| Local RAID-0 | 21 | 23009 | 340 | 373129 |
| fdatasync() | ||||
| NFS-Plymouth | 241 | 440 | 301 | 2879 |
| NFS-Cupertino | 242 | 932 | 655 | 4087 |
| Local RAID-0 | 242 | 4987 | 340 | 396313 |
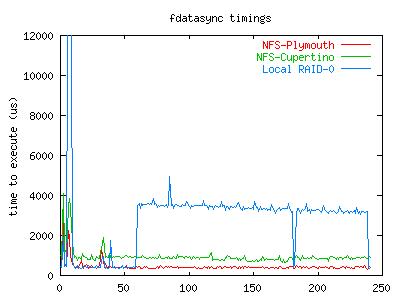
So, the fsync numbers come from a small sample and seem to vary a little too much to be too trusting of any of them. The fdatasync numbers on the otherhand are much more interesting. A local fdatasync takes over 10 times longer to execute than one against the NFS filer. To examine any effects that variance might have on these numbers, I also logged how long each individual call to fdatasync took during these runs. Below is a graph showing the time spent in successive calls to fdatasync for the three runs above.
July 25, 2001
So, we've found some places where the nfs client code takes the big kernel lock (bkl) and doesn't need to. So Chuck pointed out some areas where we could let go of the lock and still run fine. So I removed the bkl from those places and reran the test against a single nfs volume. Performance improved slightly, mostly for a smaller number of connections and a smaller number of clients. Here's a graph of the results (on the right) with the same test (using the bkl) that we ran earlier on the left.
July 26, 2001
Well, I've added some more code to the timing package to figure out what exactly what happens when fdatasync is called. For an nfs file system, an fdatasync basically consists of a loop which contains three steps. All three of these steps have to do nothing (ie are all done with their work) in any pass through the loop before fdatasync will exit. The three steps are 1) wait for locked buffers, 2) request a write on any still dirty pages, and 3) commit any written-but-not-comitted pages. In the NFS filer case, all writes come back to the client as committed because of the NVRAM, so its fdatasync doesn't write or commit any pages and is almost a null op. It does typically have to wait for one write request to return before fdatasync returns. The time it takes for the task to sleep and wake up when the page is written accounts for 99.5% of the time attributed to fdatasync in the NFS filer case.
For the linux NFS server, the case is very similar. Typically the client has to wait for one write request to return. Then, because the linux NFS server does not have NVRAM and writes do not return as committed, it generally submits a commit request for 2 to 4 pages. The next time through the loop, it waits for this request to return. Like the NFS filer scenario, the majority (about 98%) of time is spent in the two waits periods. The interesting part about the Linux NFS server is how quickly the commit request is finished (300-400 us). My initial guess as to why this is so fast is because the linux NFS server is not running any other processes during the test, so it has nothing better to do than write the dirty pages to disk before a commit request even arrives. This obviously will not be the case for the local disk.
In the local disk case, the same sort of pattern follows. All dirty or soon-to-be-dirty (locked for reading) buffers are submitted to the disk controller for writing and the majority of the time is spent waiting for the requests to be serviced. Nothing new here. Of course, since the data has not previously been written to stable storage (unlike the two NFS cases), the waiting time is much longer (on the order of 2-4 ms). The long time seems about right because it takes a couple ms for a disk to seek to a new location. The interesting part of the local disk timings though is the beginning portion when it takes just as long as the NFS cases. As far as I can tell, it is indeed making requests to the disk and waiting for those requests to complete, so its not a null op. Beyond that, i can' really tell whats going on. But since our focus is on the NFS part of the kernel, i'll move on and see if I can break through the memory limits on our NFS servers. Also, tests up to this point have been rather small, so I'll try to increase the size of the database to put more stress on the filesystem subsystem.
July 31, 2001
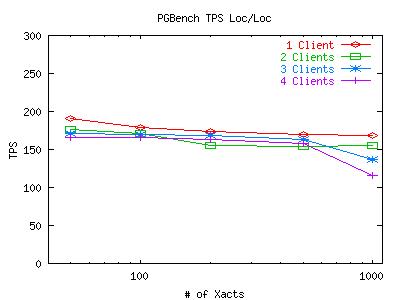
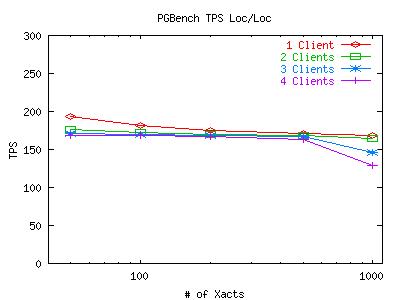
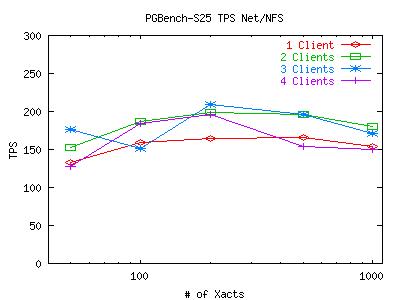
I have increased the size of the database to 25 times the default size. That means we are now working with a 2500000-tuple database which takes over 400MB of disk space. Using the fsync timing package, i saw that the same behavior applied to the NFS filer with respect to fdatasync, though the overall results of the test are different. I have run the test a few times, keeping the pgbench client on the local machine and moving it over the network (to lighten CPU usage not due to fs access). Here are graphs of the default NFS-filer run, the scaled NFS-filer run with a local pgbench client, and the scaled NFS-filer run with a remote pgbench client.
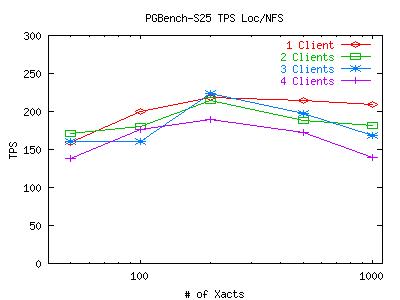
You can see some variance in the two graphs. This is mostly due to the fact that each graph is representative of one full run, not 10 like previous graphs (the test takes longer now). Looking at the kernel profiles for two scaled runs, I see that the CPU is still spending most of its time in the idle loop. One interesting difference between the scaled profiles and the default profiles is the emergence of the function skb_copy_bits near the top of the list (even when pgbench and postmaster are on the same machine) when it didn't even show up on the default profile. Also, seems to have dropped quite a bit in the list. The nfs-related functions remained lightly used and in approximately the same order.
The large amount of idle time is frustrating. PGBench seems to have trouble if I make the database larger though (it also takes forever to do anything). Perhaps the idle problem is a result of the simplicity of the transaction PGBench is executing. I think I would like to try using a TPC-C style benchmark next to see if we can generate a better load on the system. Also, I have obtained a copy of Oracle 8 for linux that I would like to compare to PostgreSQL.
Another interesting feature of the remote pgbench client test is the sub-par performance of the single-client configuration. What hinders the single client performance. Or is it a case of the multi-client runs being able to take advantage of something the single-client can't?
September 27, 2001
So, its been a long time since I've updated this page. Partially I've been busy with the start of school and partially its because it takes a very long time to process the data I'm about to present. Towards the end of August I used pgbench (the extended 1, 2, 3, and 4 client tests described in the July 31, 2001 section) against a Postgresql database to see how it used its NFS partition with various mount options. Between runs, I would remount the NFS parition with different mount options (varying rwsizes and using the noac option). While running these tests, I collected a slew of data using tcpdump. Since the tcpdump file was so large for each test, processing this information has been a cumbersome experience. After looking at the data several different ways, I've found the following sets of graphs to be the most insightful (at least at a large-scale level).
October 2, 2001
I went back and rechecked the scripts that generated my graphs and I have found an error. So, the neat stuff I had up here on 9/27/01 has been removed. Instead, I have some not-so-interesting graphs to show. They still show that all runs are read intensive and that runs with the NOAC set also have an abundance of getattr calls. The time to execute these calls does not vary nearly as much as I had proposed last Thursday. In short, here are the corrected graphs.
Each graph describes when NFS calls are put on the wire and how long they take to receive a first response. Each point represents the dispatch of a particular NFS function on the wire. The X-coordinate of the point describes when in the test this function-request was made, and its Y-coordinate describes how long it took the NFS server to send its initial reply. The X-axis is plotted in seconds from 0 to 3000 and the Y-axis is plotted in seconds from 0 to 0.15 (or 150 ms). The first set of graphs show how often the client uses the NFS "read" operation.
| RW Block Size | NOAC Option Not Set |
|---|---|
| 1k | 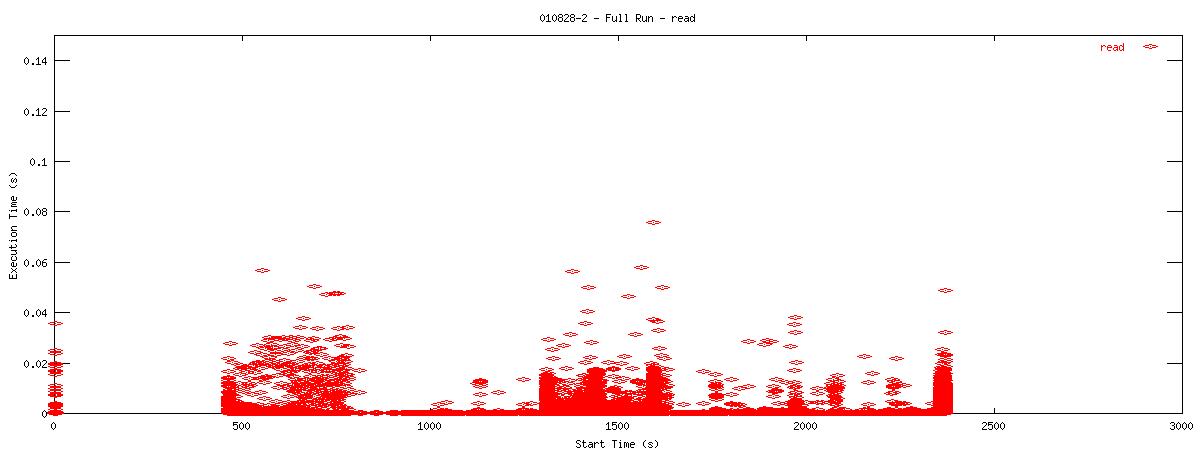 |
| 2k | 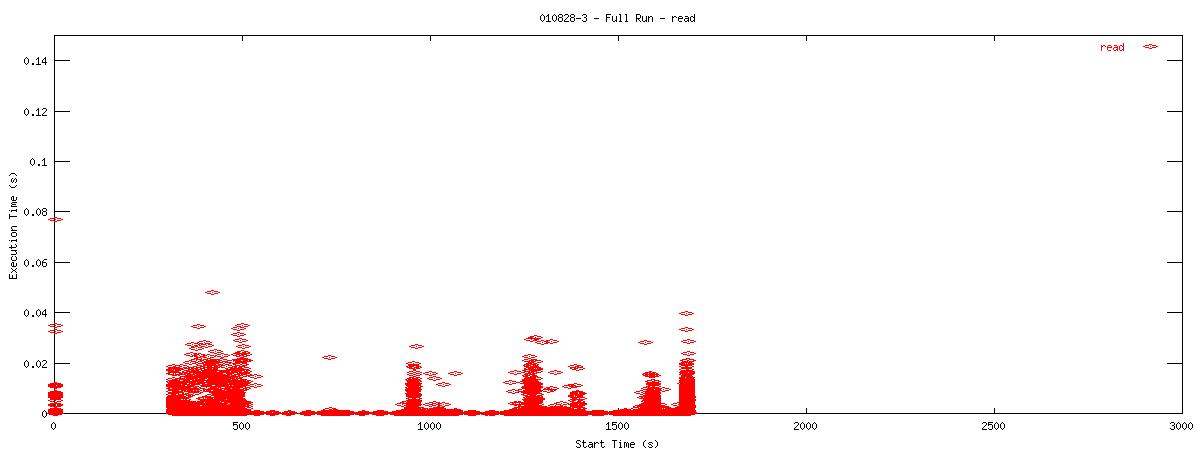 |
| 4k | 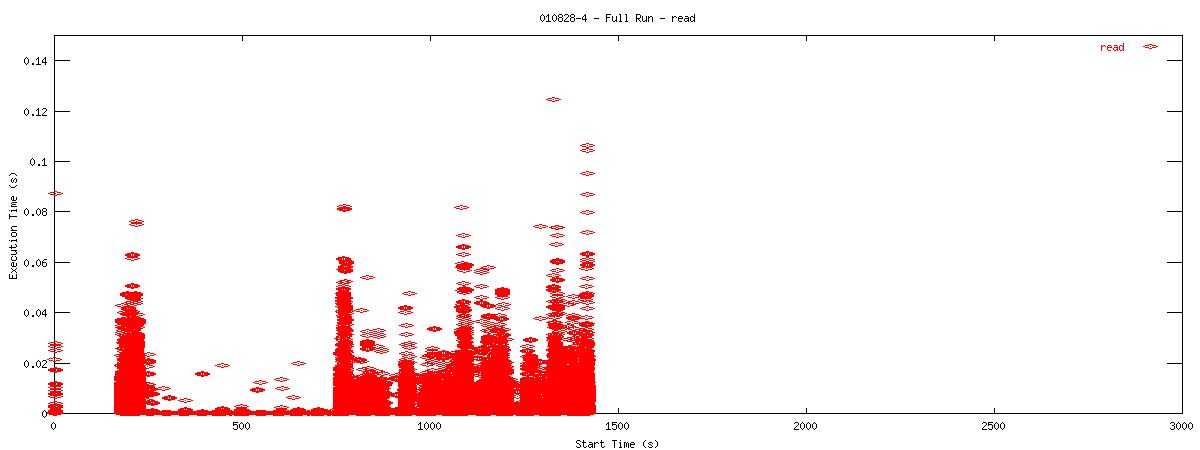 |
| 8k | 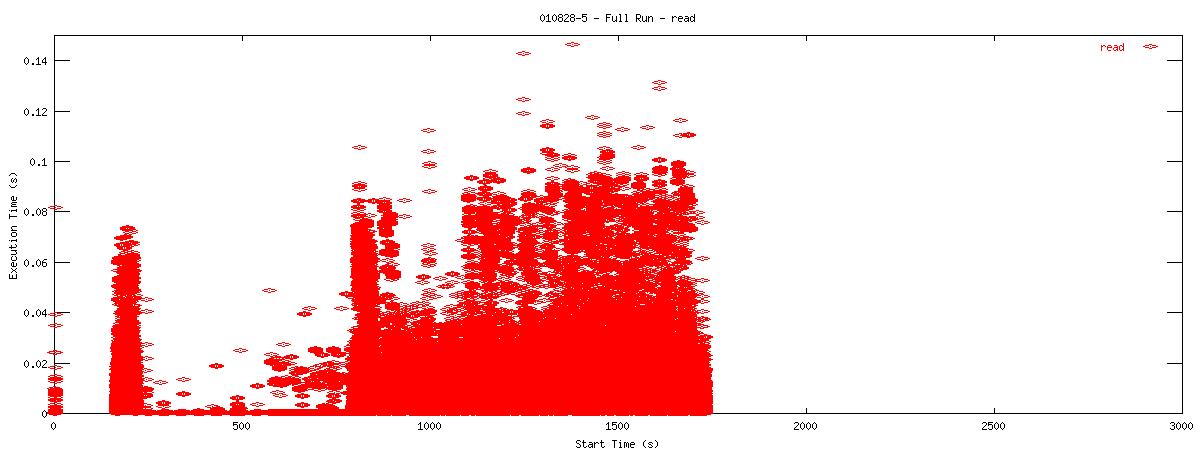 |
| 16k | 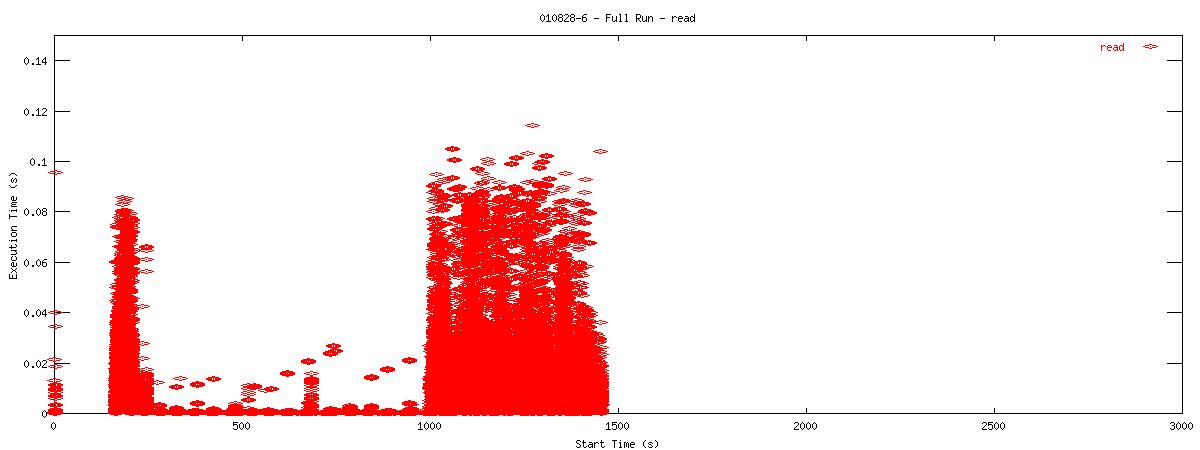 |
| RW Block Size | NOAC Option Set |
| 1k | 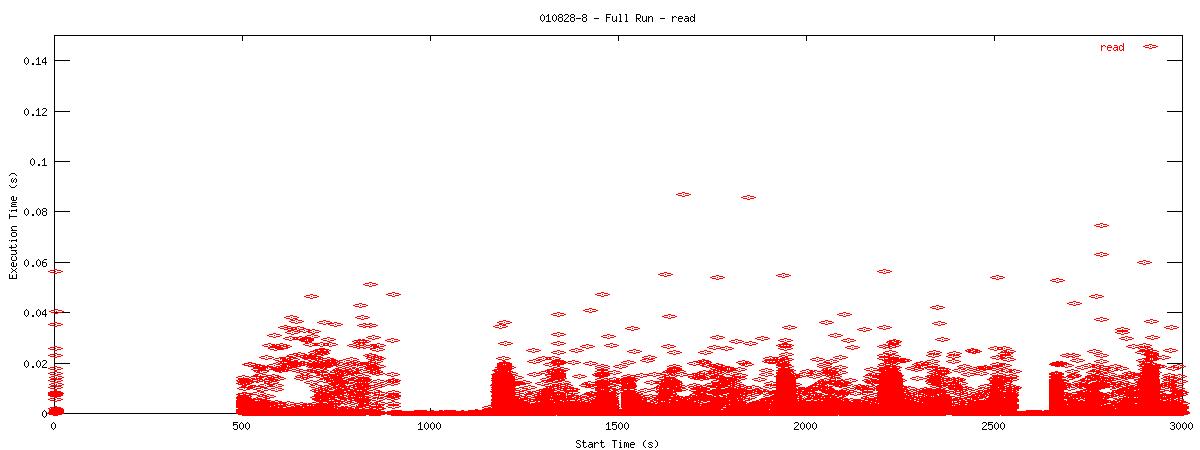 |
| 2k | 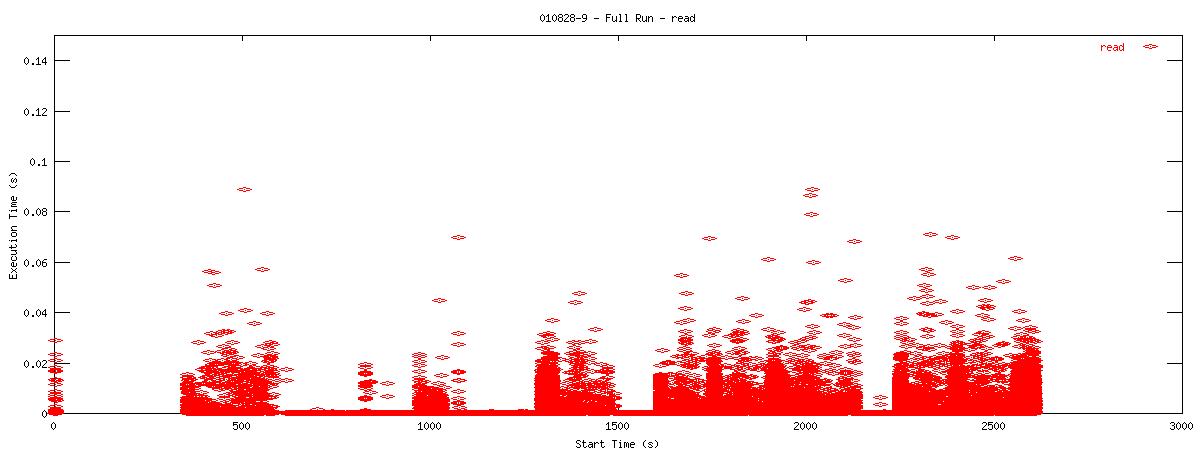 |
| 4k | 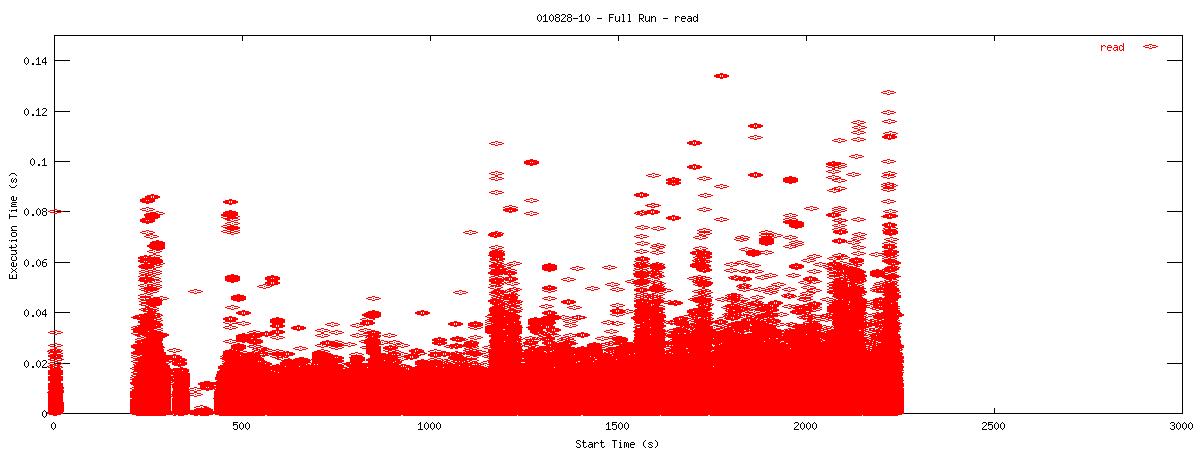 |
| 8k | 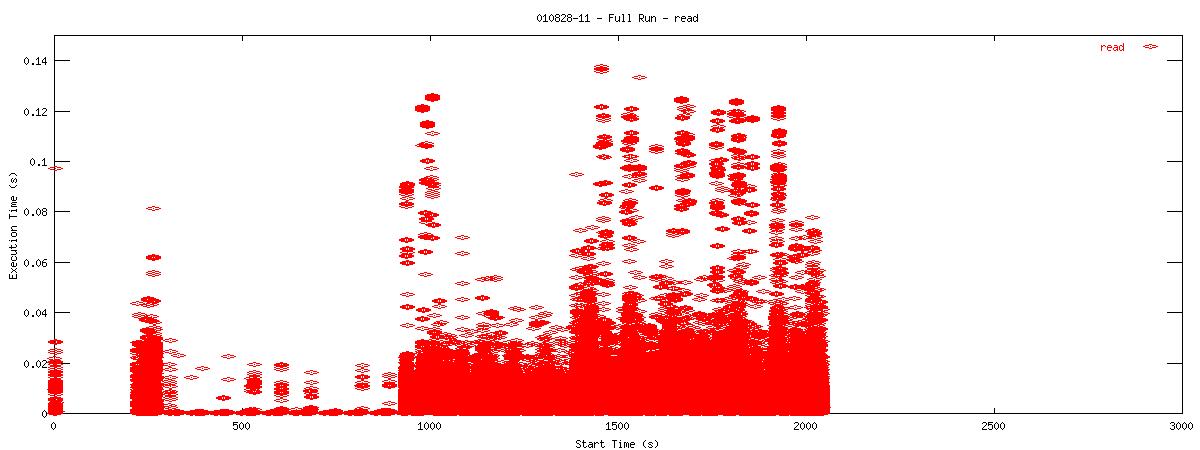 |
| 16k | 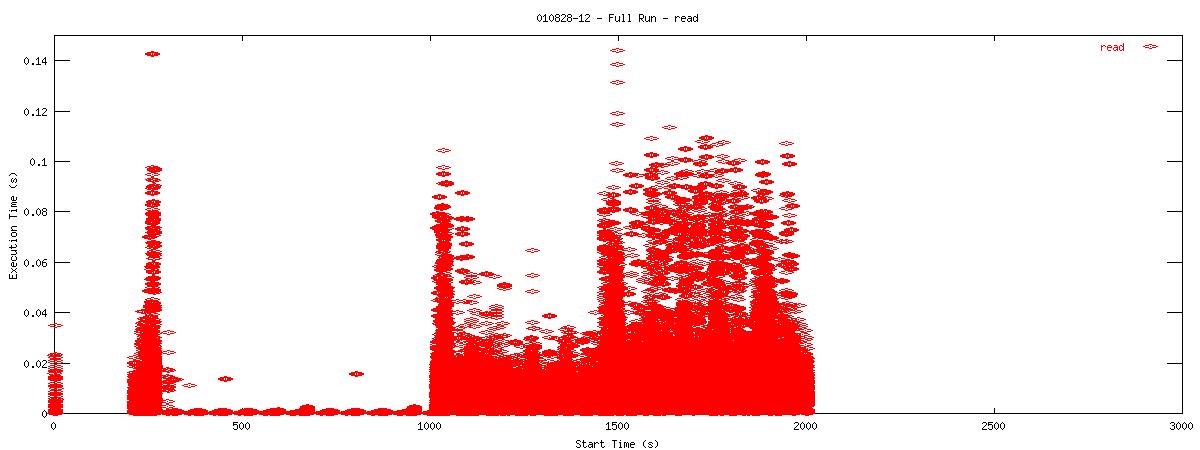 |
You can see that when the NOAC option is set or not set, the 1k and 2k cases seem to issue much fewer read requests. Also, since all these graphs are on the same scale, you can see that when the NOAC option is set, the pgbench test takes longer to complete. It is also interesting to note that As for the extended length of the test when the NOAC option is set, lets look at the same style graph, but this time for the "getattr" NFS function.
| RW Block Size | NOAC Option Not Set |
|---|---|
| 1k | 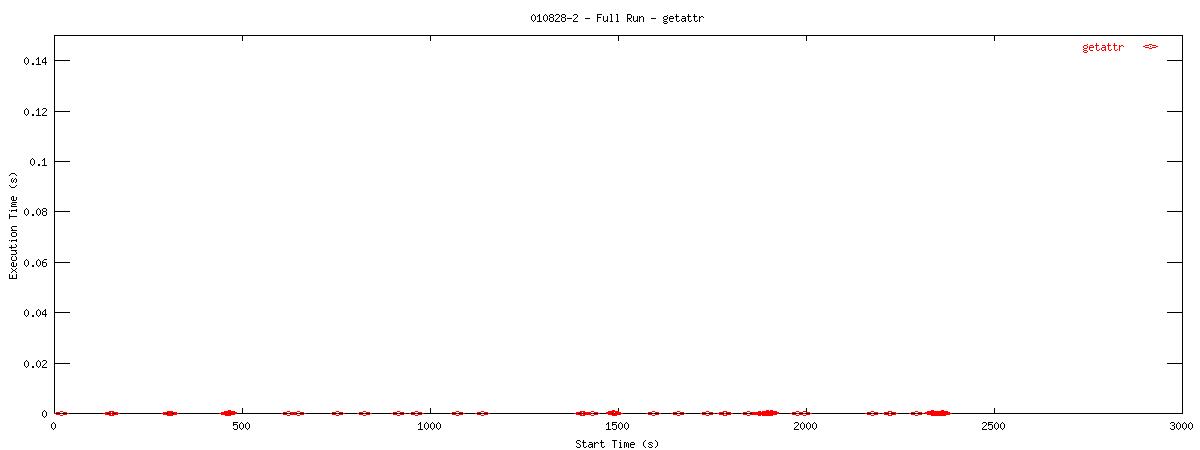 |
| 2k | 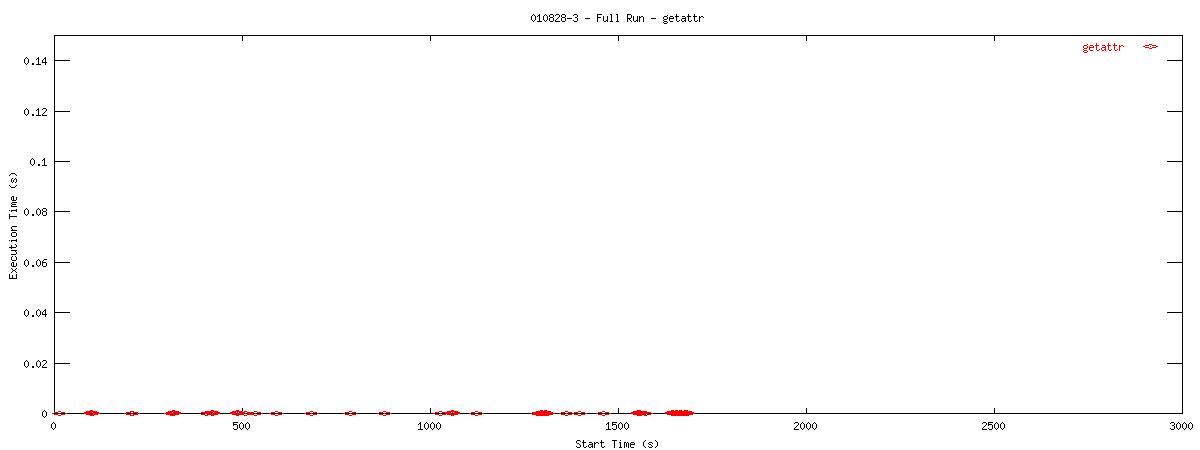 |
| 4k | 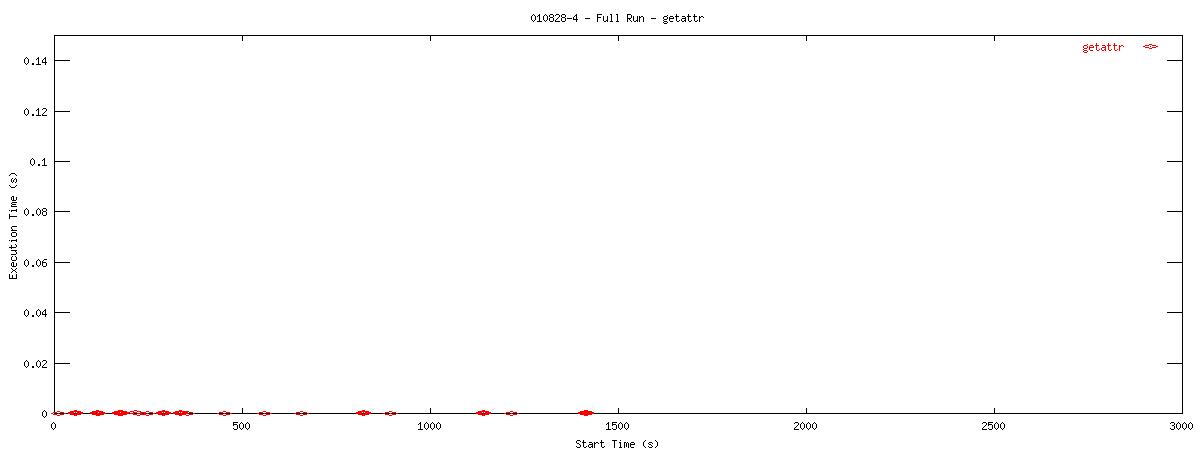 |
| 8k | 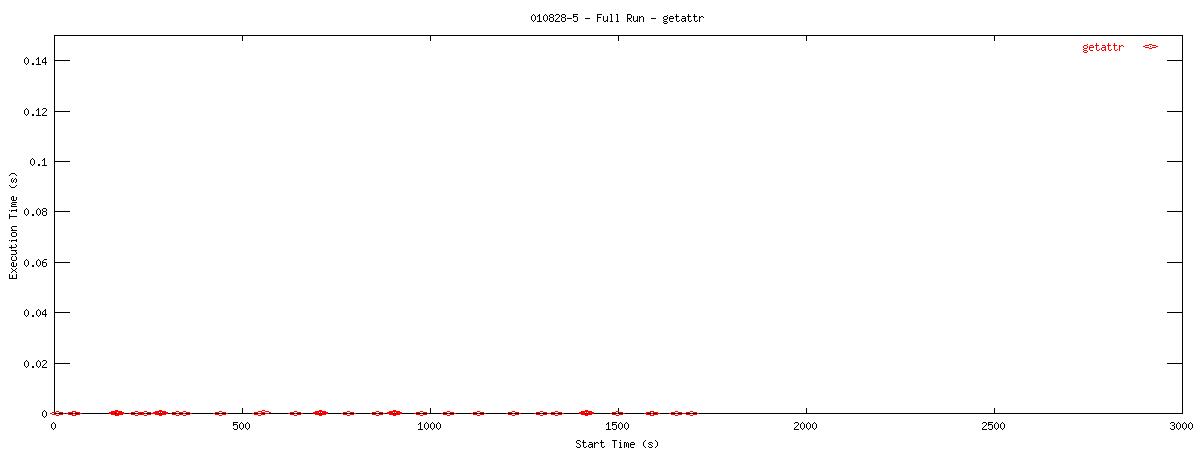 |
| 16k | 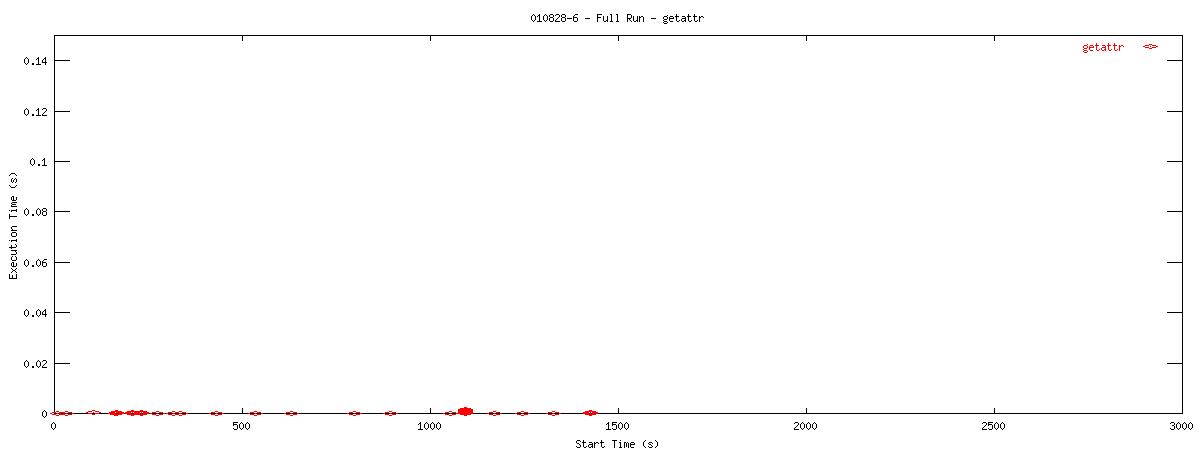 |
| RW Block Size | NOAC Option Set |
| 1k | 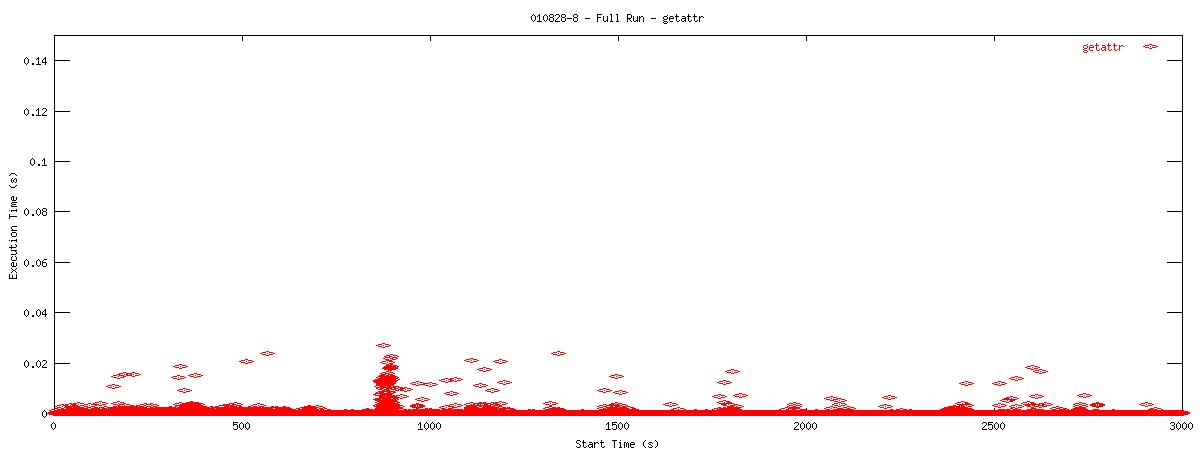 |
| 2k | 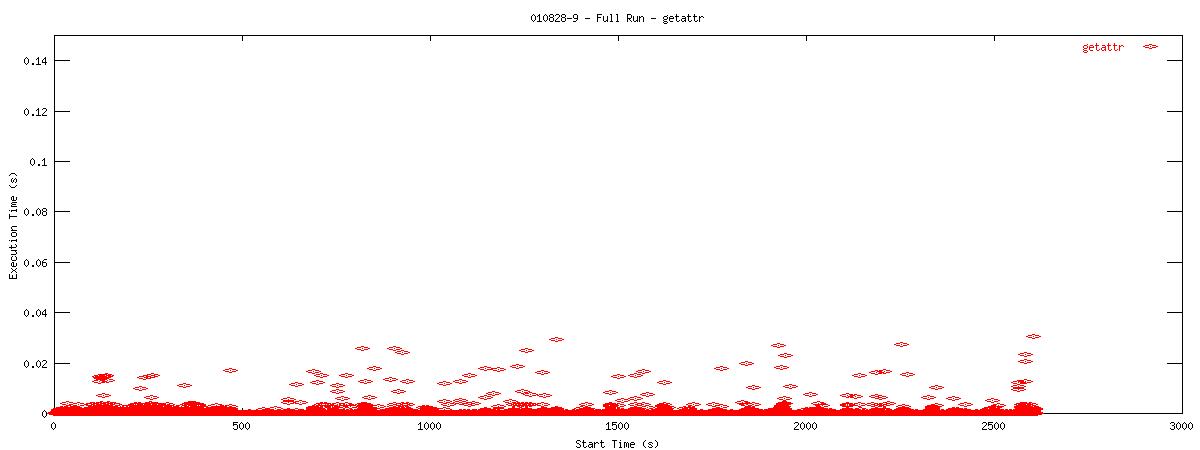 |
| 4k | 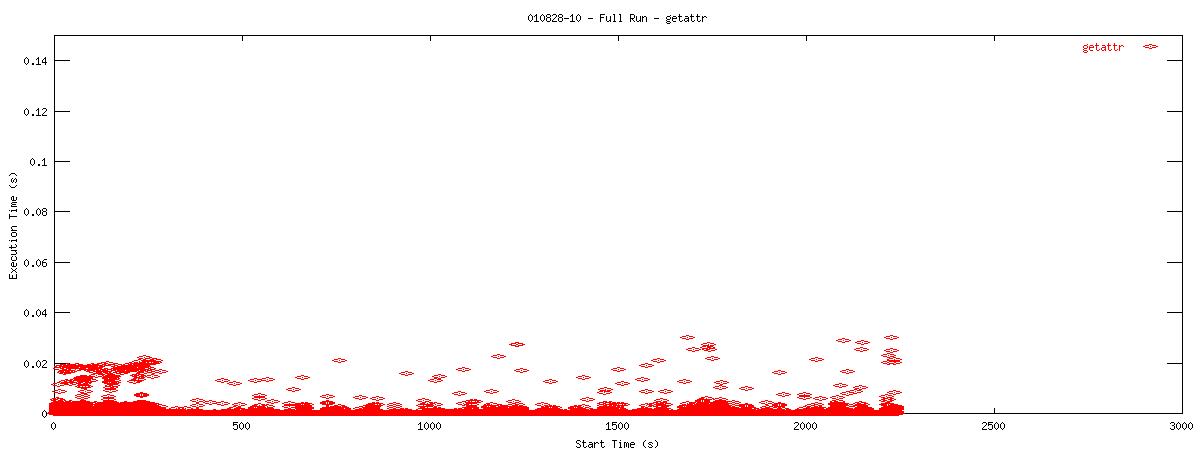 |
| 8k | 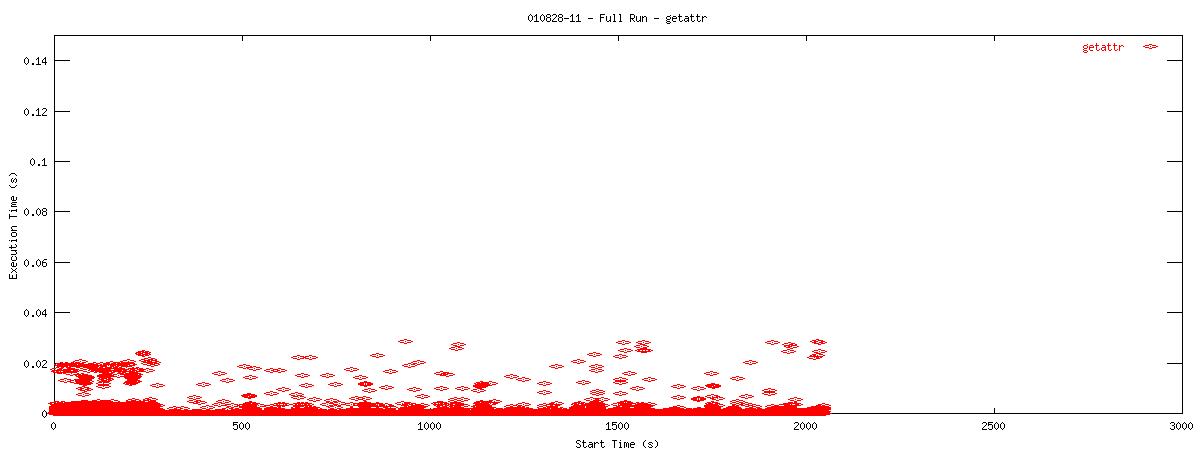 |
| 16k | 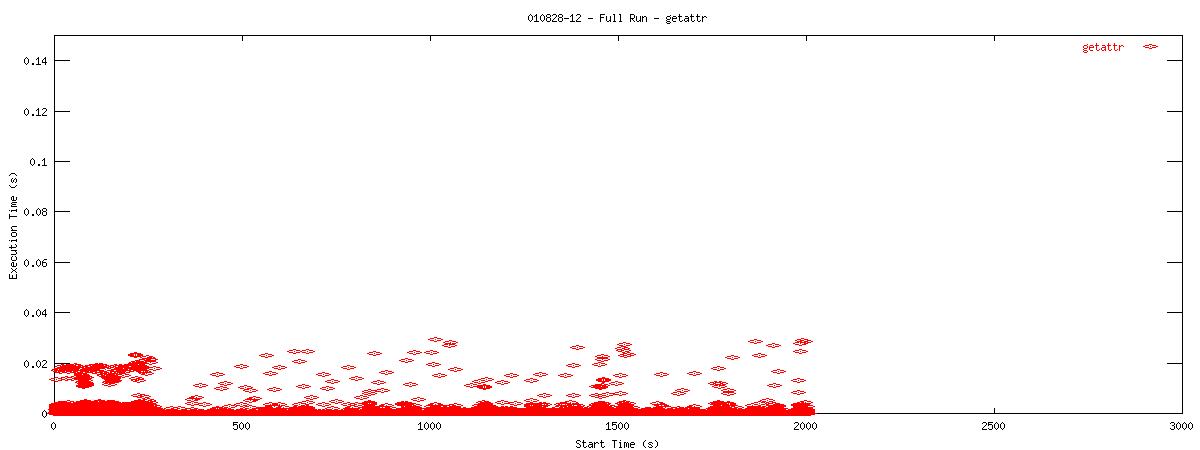 |
You can see that setting the NOAC option when mounting an NFS filesystem for use with a postgresql database causes lots of additional requests to go across the wire. Just to give some sort of perspective as to how much of a bottleneck these two functions may be, the last set of graphs in this series plots all other NFS functions in the same manner as the graphs above. Notice the how sparse these functions are in comparison to "read" and "getattr".
| RW Block Size | NOAC Option Not Set |
|---|---|
| 1k | 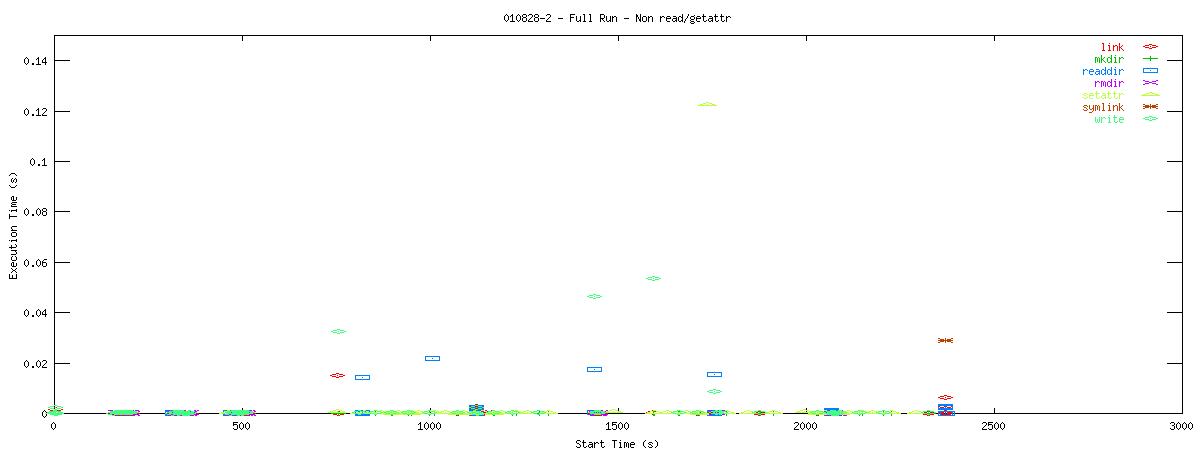 |
| 2k | 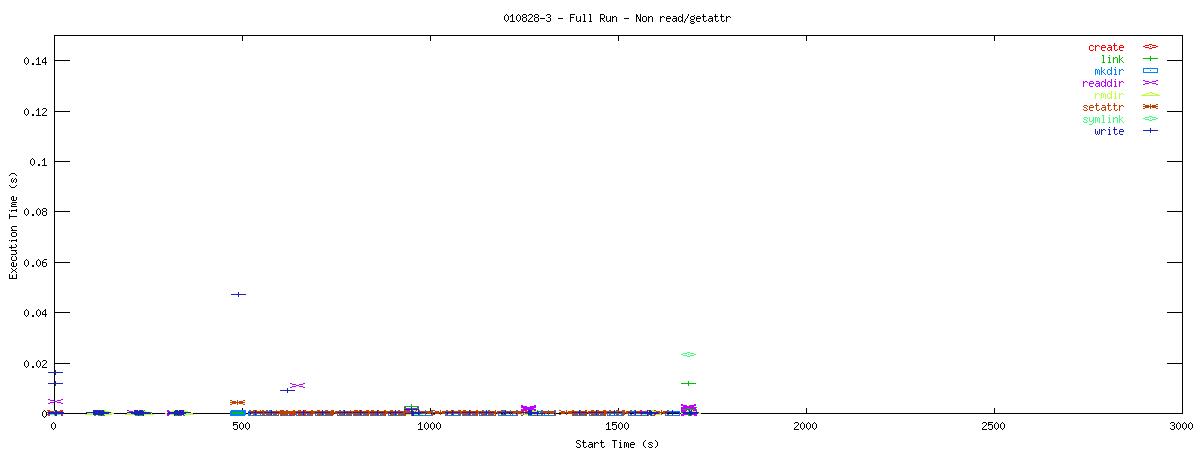 |
| 4k | 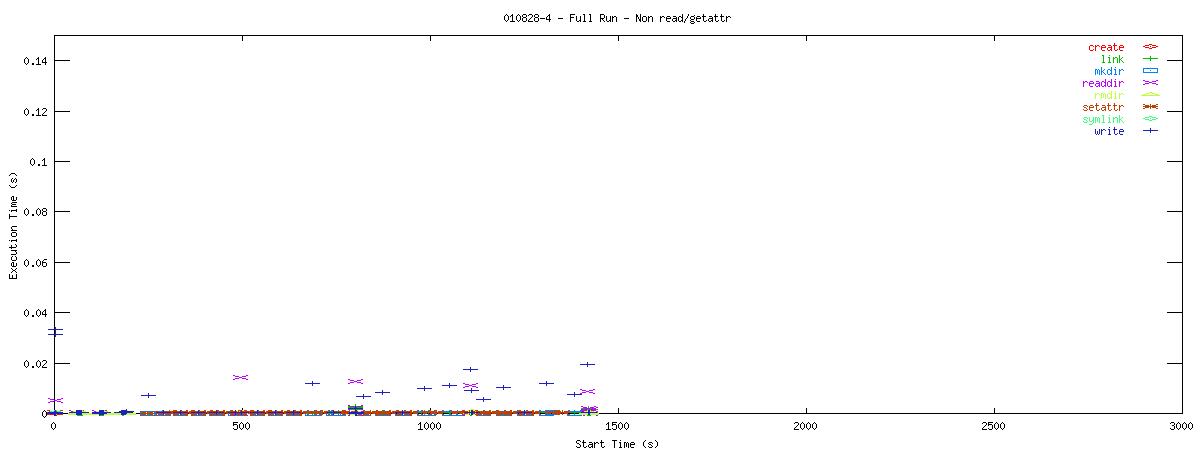 |
| 8k | 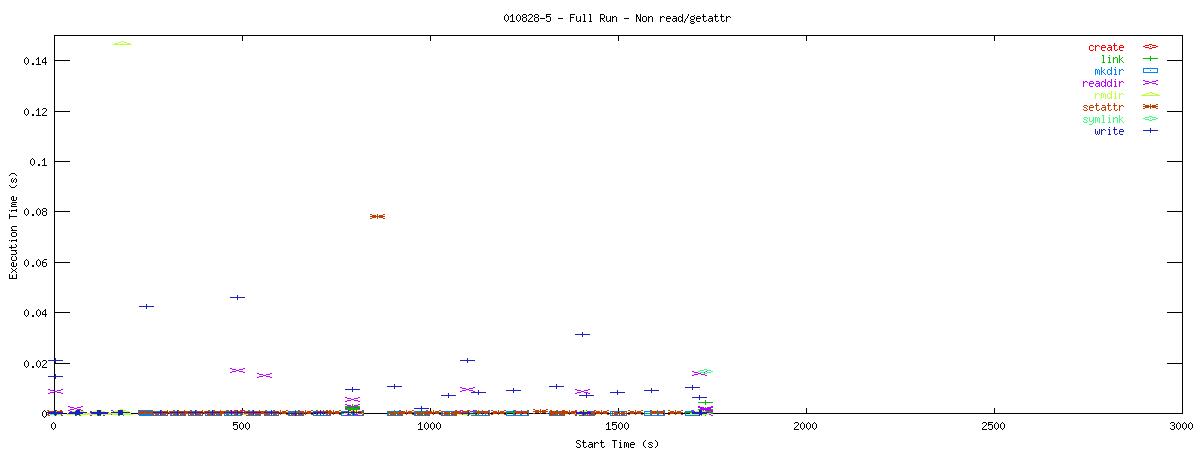 |
| 16k | 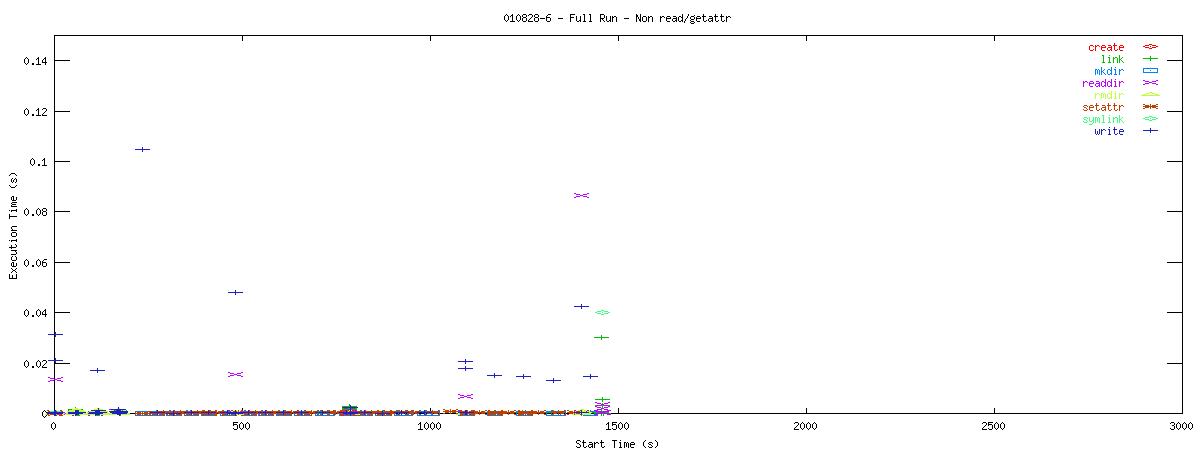 |
| RW Block Size | NOAC Option Set |
| 1k | 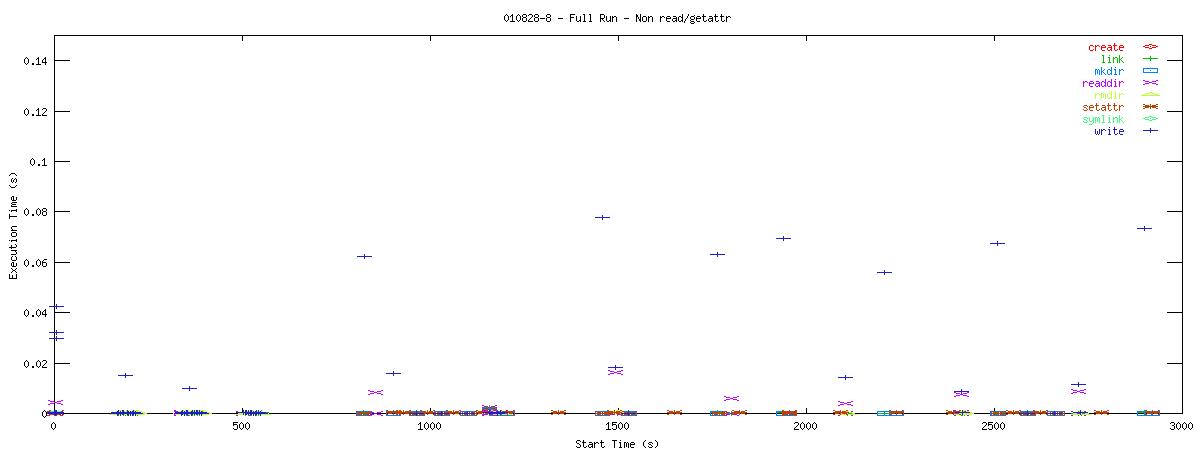 |
| 2k | 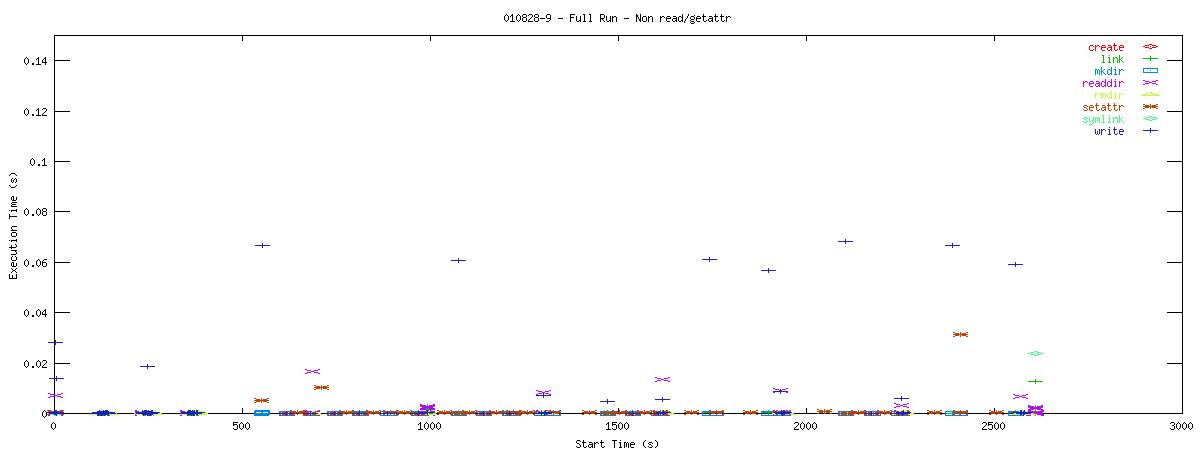 |
| 4k | 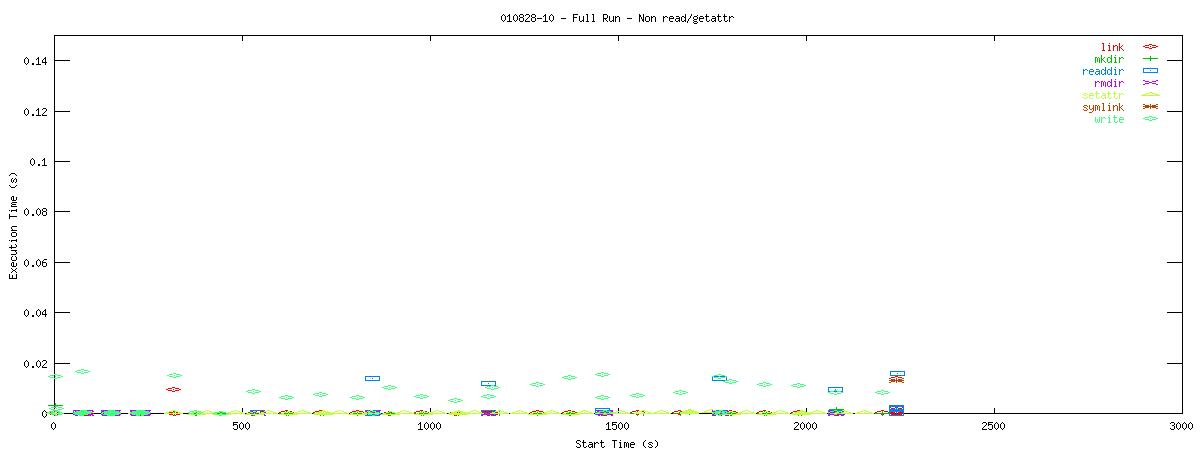 |
| 8k | 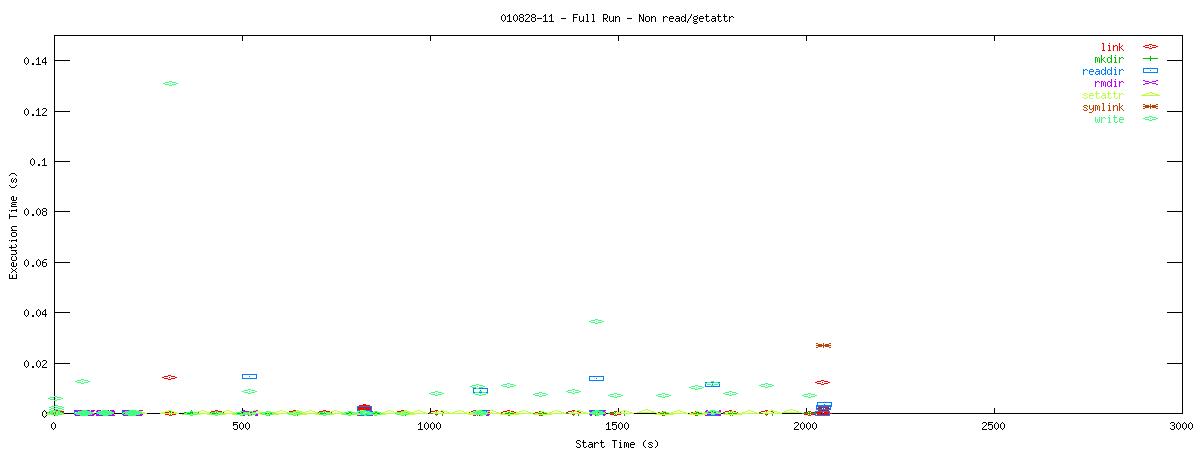 |
| 16k | 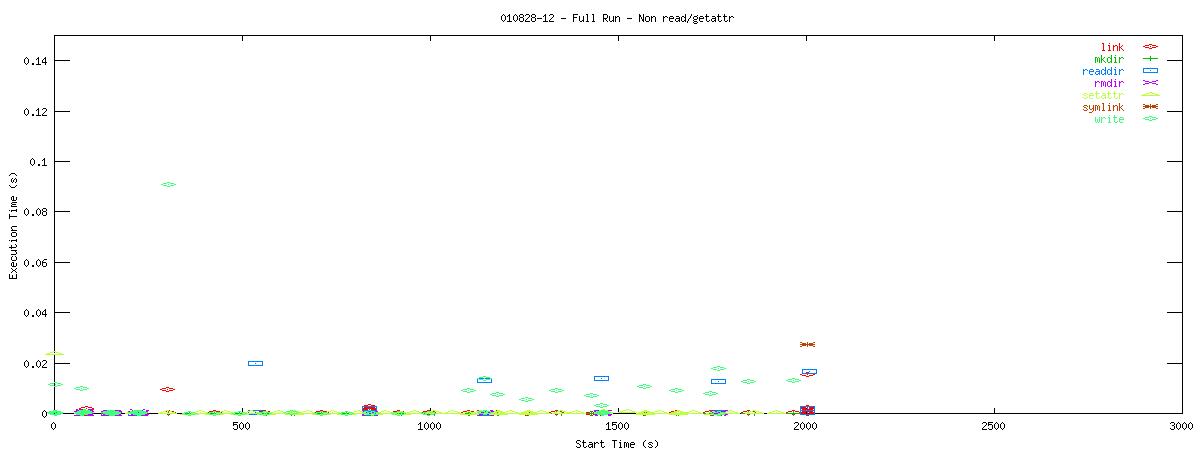 |
Of course, seeing that these two functions are often used does not help tremendously at this point. It points to an initial area of focus for improving NFS for use with databases though. The obvious next question that comes to my mind is "Does Oracle display the same type of behavior?" For that matter, it would be worthwhile to explore another macro-benchmark for databases that would show that this read/getattr intensive pattern is not unique to the pgbench program regardless of the type of database server.
After gaining a better understanding of which NFS functions require the most focus for database performance, we'll next want to generate a suite of micro-benchmarks aimed at determining how available memory or types of queries affect the use of NFS calls. Is there a difference between joining two tables and simply scanning a single table? What if the database uses a secondary non-clustered index in a series of queries or joins? How is NFS used in these situations and where are its shortcommings?
Outstanding Issues
- What is the bottleneck when 20 or 30 clients try to connect at the same time? Its not CPU or network. FS doesn't appear to be the culprit, but is it? Is some other system resource creating this strange degredation? Is the problem with the postmaster or the pgbench client code?
- Why does the local fdatasync do so well for the first 60 calls and then start running at disk speeds? As far as I can tell, its still making the same requests during the first 60 as it is on the last 180.
- After gaining a better understanding of which NFS functions require the most focus for database performance, we'll next want to generate a suite of micro-benchmarks aimed at determining how available memory or types of queries affect the use of NFS calls. Is there a difference between joining two tables and simply scanning a single table? What if the database uses a secondary non-clustered index in a series of queries or joins? How is NFS used in these situations and where are its shortcommings?
Test Machines
This table is a quick description of the machines used in the above tests. For more information on any particular machine, see the test bed description page for the NFS client performance project.
| Name | Description |
|---|---|
| Climax | Climax is a dual processor Pentium III system based on the ServerWorks III LE chipset. The processors run at 933Mhz with 256K of level 2 cache, and the front-side bus and SDRAM speed is 133Mhz. There is 512Mb of RAM in this system. Climax has two, 18.1Gb IBM SCSI drives (model:DDYS-T18350N Rev:S96H). The Serverworks chipset supports two 64-bit/66Mhz PCI slots; there is a Netgear gigabit ethernet NIC in one of these that supports 1000base-T. This system has a Linux 2.4.4 kernel with the Red Hat 7.1 distribution installed on one SCSI disk and FreeBSD 3.4 installed on the other disk. For performance purposes, one Linux partition has been created on the otherwise FreeBSD partitioned disk. This machine serves as a regular client for the Specweb99 tests. For the PGBench tests, this is the machine that "hosts" the database and runs the database server (postmaster). |
| Cupertino | A four-way Intel system based on the i450NX mainboard. There are four 500Mhz Katmai Pentium III CPUs, each with 512K of level 2 cache. The front-side bus and SDRAM speeds are probably 133Mhz. The system contains 512Mb of RAM and six Seagate SCSI LVD drives of varying model, controlled by a Symbios 53c896 SCSI controller. The system is network-connected via a Netgear 1000base-T ethernet NIC installed in a 32-bit/33Mhz PCI slot. This system is running a Linux 2.4.4 kernel with the Red Hat 7.1 distribution. This machine serves primarily as the web server for the Specweb99 tests. If necessary, it can also be used as an NFS server. As of yet though, it has not been used in such a capacity for the tests described above. |
| Tiffin | Tiffin is a dual processor Pentium III system based on the ServerWorks III LE chipset. The processors run at 933Mhz with 256K of level 2 cache, and the front-side bus and SDRAM speed is 133Mhz. There is 256Mb of RAM in this system. Tiffin has one 30Gb IBM Deskstar 70GXP EIDE UDMA100 drive. Because of limitations in the Serverworks south bridge, the IDE disk runs in multiword DMA mode 2. The Serverworks chipset supports two 64-bit/66Mhz PCI slots; there is a Netgear gigabit ethernet NIC in one of these that supports 1000base-T. This system is running a Linux 2.4.4 kernel with the Red Hat 7.1 distribution. Tiffin is used as the Prime Client for the Specweb99 tests and is also used as the PGBench client(s) when they are moved off of the machine that also runs the postmaster. |
| NFS Filer (Plymouth) |
The Network Appliance filer I used for these benchmarks is an F85 system with eighteen 36Gb Seagate 336704LC SCSI drives. The F85 has a single 833Mhz Pentium III with 256K of level 2 cache, 256Mb of RAM, and 64Mb of NVRAM. The system supports several 64-bit/66Mhz PCI slots which contain a Q-Logic ISP 1280 SCSI controller and a fiber optic gigabit ethernet card. Data stored on this system is striped in RAID 5 volumes. This system is running a pre-release of Network Appliance's DATA ONTAP operating system. The filer is used as the NFS server for both Specweb and PGBench tests. |
|
 |