| |||||||||
|


Analysis of a 2000 MB write to a Linux server
As a follow-up to my previous analysis, I performed the same test against a Linux NFS server. The behavior of the Linux server was quite different, as I will show.
Overall Picture
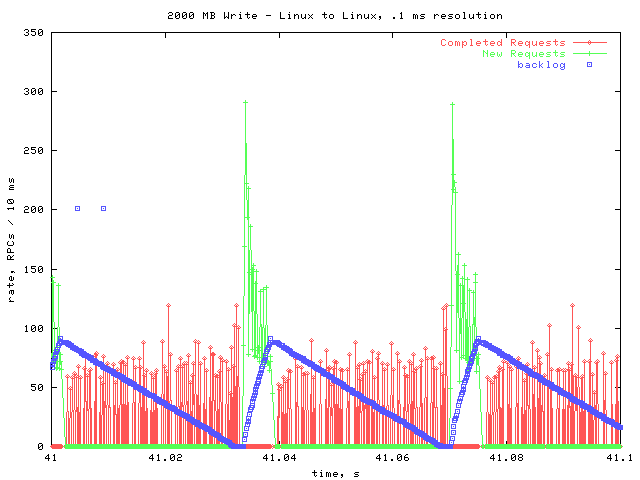
Here is the overall picture of the 2 GB write.
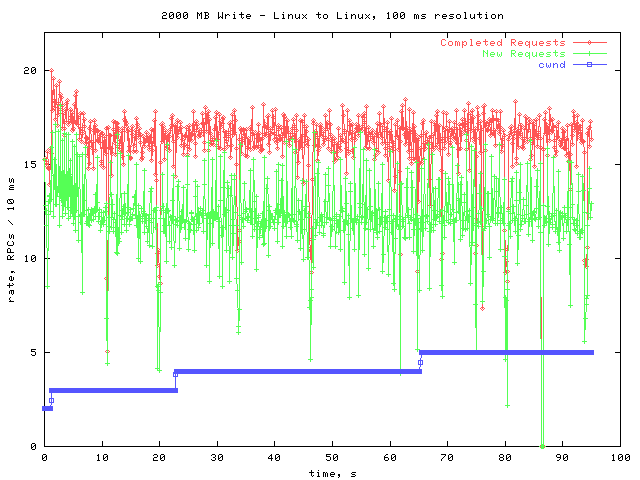
The rate of new and completed RPCs is steadier than it was against the F85 file server. No timeouts occurred, so the cwnd was allowed to steadily climb. In order to see what would happen as the cwnd continued to climb, I performed another 2 GB write after the first.
Second 2000 MB Write
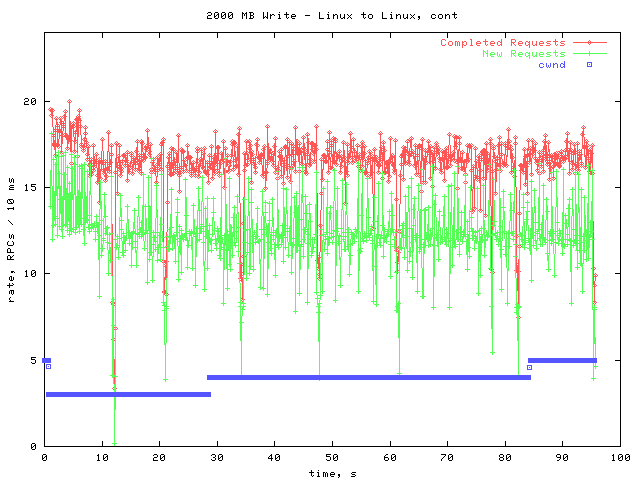
A timeout occurred at the very beginning of the transfer, cutting the cwnd from 5 to 3. This does not appear to have effected the transfer rate, as the graph looks very similar to the first one.
There are a couple of interesting features of these graphs. One is that the rate appears to be higher for the first few seconds of each graph, but quickly declines. Also of interest are the 'downward spikes' where there is briefly no activity.
Before I examine these particular features, here is a typical .1 second window at high resolution.
A Closer Look
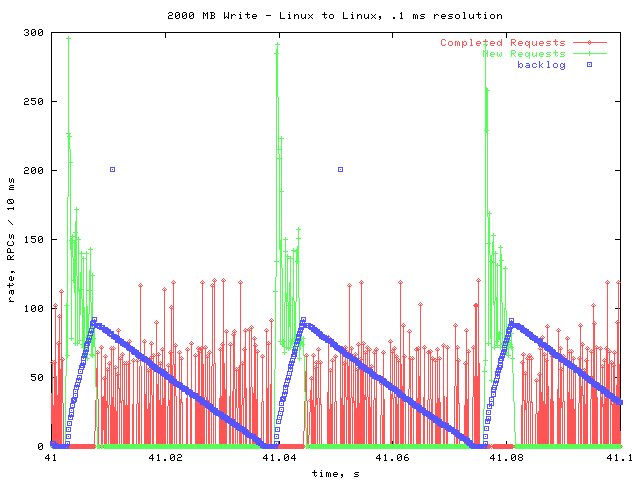
This graph is very similar to the corresponding graph I made for the F85. In both cases, the NFS layer produces a burst of write requests, filling the backlog. Then, the RPC layer works on completing the backlogged requests. Once the backlog is empty, there is another burst of write requests. During the time when new requests are coming in, no requests are being completed.
Next I will examine the higher rate at the beginning of the transfer.
Higher Rate
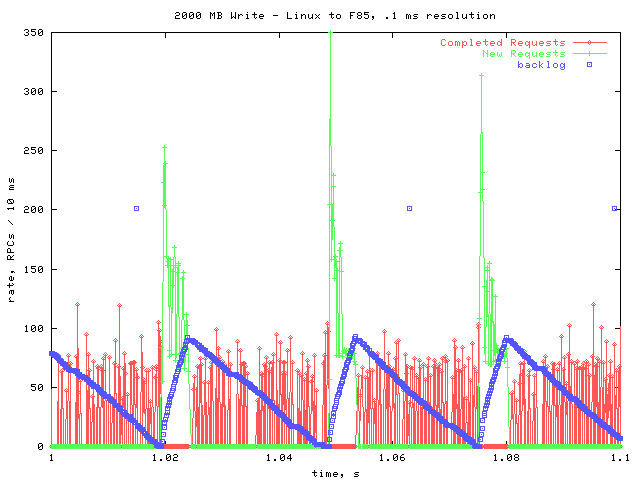
This is a .1 second window from the portion that had higher new & completion rates. There are no obvious differences between this graph and the previous one. Further investigation and analysis will be necessary to determine why the rates are higher near the beginning of these transfers.
Gaps
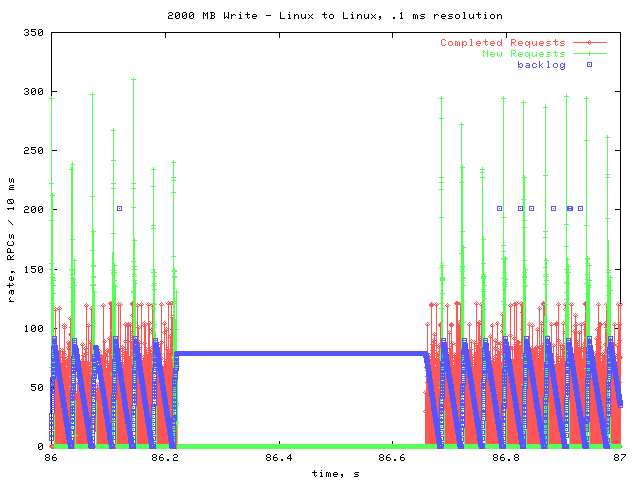
The two dips that go all the way down to zero in the overall graphs looked like this one. In this case, there were 5 requests on the pending queue (not shown) for the duration of the gap. This may mean that the server stalled a bit. It could also mean that the client was busy doing something else; i.e. the 5 requests had already gotten replies, but the cpu was busy with another task, so they weren't yet taken off the pending queue.
The other, more common, dips looked like this:
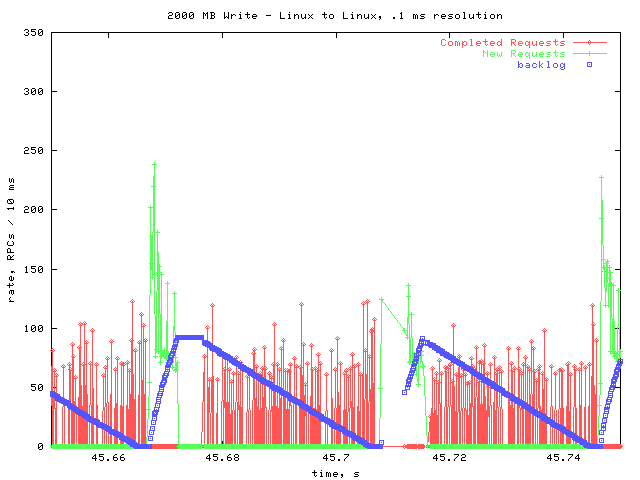
At roughly 45.67 seconds, there was a delay similar to the other kind, but much shorter. However, this time there are no requests on the pending queue. Therefore, it cannot be that we are waiting on the server during these gaps.
There is also a place at 45.71 where ther is a gap in the data, meaning that no data points were taken for that time period. This commonly happened near where these small dips occur. It seems likely that another process pre-empted rpcstat for that time period. It may have been the same process that stalled the RPC activity.
Conclusions
Overall, the behavior using the Linux server seems much more stable than when using the F85. The major oddities that I saw with the F85 did not appear in testing with Linux. Namely, there was only one timeout instead of regular timeouts; and while there were some dips in RPC activity, they were not as severe, nor as regular, as the dips that occurred in testing against the F85.
Further investigation is necessary to explain these oddities in the behavior with the F85. Future examinations will try using an NFS volume with more disks in it; this should provide better disk throughput, and may decrease or eliminate the gaps that occur every three seconds. I will also be trying some patches to the NFS layer that Chuck has been working on.
|
 |